Mission
MISSION
To develop and promote the science of visual analytics and to advance interactive visualization as an integrative discipline that is indispensable for attacking key real world applications
Events
–
Visualization Courses
Spring 2024
- ITCS 4122/5122: Visual Analytics – Prof. Jing Yang
- ITCS 4122/5122: Visual Analytics – Prof. Zhaocong Yang
- ITCS 4122/5122: Visual Analytics – Prof. Wenwen Dou
- ITCS 6124/8124 Illustrative Visualization – Prof. Aidong Lu
- ITCS 3120 Intro. Computer Graphics – Prof. Zach Wartell
For visualization courses offered on additional semesters, see the VisCenter Courses page.
Visualization Highlights
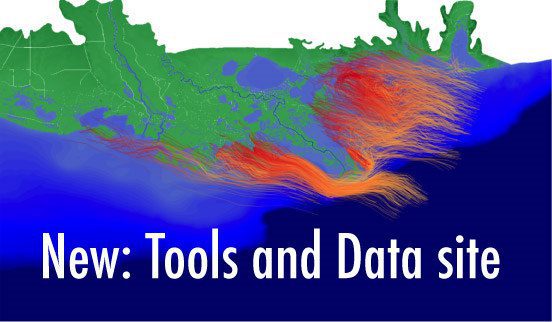
Web-based System for Responding to Critical Infrastructure Breakdown
When a large scale disaster, such as a hurricane, hits, breakdowns at key points in the electrical grid can cascade over telecommunication, water, gas, road, and other systems. Key facilities, such as schools, police and fire stations, government building, and hospitals, can be affected significantly. In this research funded by DHS, we have developed a Web-based tool to tap into simulations for thousands of different hurricane paths, immediately selecting the one that most closely matches the current event and visualizing the results so they can be rapidly understood and acted upon. The database can also be updated on-the-fly with new simulations that follow the predicted hurricane path. Thus an emergency responder in the field can get updates about when a hurricane will hit her area, where and what parts of the infrastructure will be disrupted, what key facilities will be affected and when. To view the tool in action, click here.
Mobile Emergency Response System: Mobile system excels in recent large emergency response exercise.
recent news
Professors Wenwen Dou and Zachary Wartell have jointly accepted the position of Co-Director of The Ribarsky Center of Visual Analytics…
Date Published: Wednesday, October 16, 2019 Contratulations on VisCenter members’ participation in IEEE VisWeek 2019 Participation in IEEE VisWeek 2019
Date Published: Wednesday, September 27, 2017 Congratulations to Dr.’s Wenwen Dou, K.R. Subramanian, Samira Shaikh, Paula Goolkasian, and Isaac Cho…
Date Published: Wednesday, August 30, 2017 Professors Zachary Wartell and Dan Janies have jointly accepted the position of Co-Director of…