Advanced Visual Analytics Tools & Data
These tools and data collections were developed under the DHS Center for the Study of Natural Hazards (DIEM Center). They are available to colleagues in the DIEM Center of Excellence, to government partners, and to collaborators.For more information on obtaining them, contact Xiaoyu Wang or William Ribarsky.
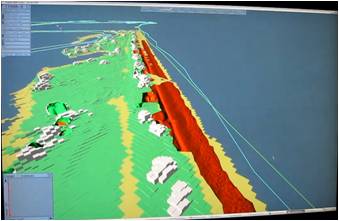
Terrain Atlas and Visual Analysis DSS system
To provide a common picture across multiple models, we have developed an integrated probe-based visualization to bring interactivity to the analysis of coastal infrastructure changes. We developed a data model and a database structure to organize and permit retrieval of comprehensive collections of LIDAR scans over time. With a geographic viewer developed for the purpose, one can identify and retrieve multiple scans from different times, which in coastal areas are often overlapping in whole or in part. The LIDAR data can be retrieved as a point cloud or as a polygonal terrain model at any selected resolution. LIDAR scans at the same location for different times can be compared to quickly calculate and display changes. This tool is currently provided to our collaborators’ groups. Our longer range plan is to make the atlas available to other members of the DIEM team and to customers such as FEMA and NOAA.
Learn more about this project
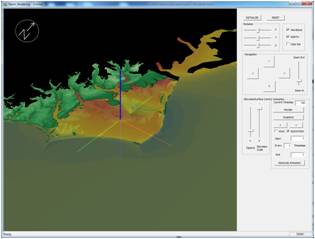
Storm Surge Animation and Analysis
We have developed a visualization system combining a user-friendly interface with advanced rendering techniques to provide a useful and effective environment allowing scientists and emergency responders to view and analyze data from multiple 4D (3D, time) models or observations in a unified visualization system. In particular, we have developed a digital storytelling approach that generates automatic animations for time-varying data. The design of this system aims to help users to create the best animations of storm surge over terrain, where users can interactively adjust items such as storm surge scale, transparency, viewpoint, fly-through path, coloring, and other factors to bring out the features they want to see. Our approach simulates the composition and transition of storytelling techniques and creates animations to describe various event features. Ultimately this results in characterization of the surge simulation quite compactly and understandably in terms of its main features.
Learn more about this project
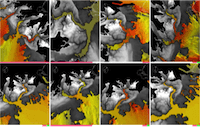
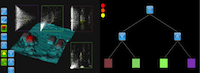
Event Structure Analysis for Hurricane Wind and Eye movement
The event structuring system is general and will be used for identifying and tracking a variety of events in space and time. (It has been used to identify and follow storm surge events such as hurricane wind and eye movement, storm surge inundation events, and others.) This system will permit the investigation of multiple models together (e.g., storm surge, river inundation and flooding, rainfall, severe storm winds) to provide a comprehensive picture of a large-scale disaster. The geographic visualization will provide a common picture of these models together to see where there is correlation and interrelationship, but, more importantly, the event structuring will provide a complete, unfolding story of the disaster. We will work to provide our tools and scenarios to emergency planners and responders in the Carolina coastal region. Simulations of storm surge and flooding localized to particular coastal communities are also under discussion. More generally, the event structuring system can be applied to large scale storm events anywhere where there is interest and appropriate simulation results.
Learn more about this project
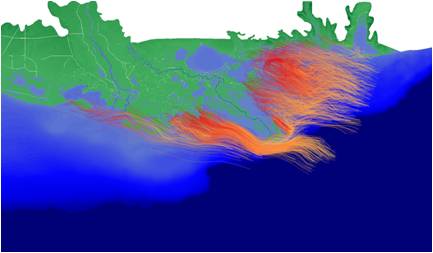
Oil Spill and Dispersion Animation and Analysis
We have developed an interactive visualization system to analyze and validate the simulation runs of oil spills. The prototype visual simulation and validation tool has been completed in close collaboration with DIEM members from the UNC Marine Sciences Institute, U Texas, and others. Results from the runs have been validated and shared. This system is based on a new time-varying data visualization method, which quantifies abstract 3D (2D oil particles + time) data features to 2D curves. Both quantitative measurements and visual comparisons are provided to analyze and validate the simulation model. We expect our new visual validation approach will allow scientists to compare the entire time duration of oil spill simulations visually and select different data features. Our method can be easily extended to other scientific simulations, like storm surge.
Learn more about this project
Linked Geospatial Feature-Space Analysis
Building on our Terrain Atlas and Visual Analysis DSS system, we have developed a semi-immersive visual analytics environment that will permit terrain feature identification and extraction. Terrain features such as buildings, roads, bridges, trees and other vegetation, dune structures, excavations or build-up (e.g., scouring under a bridge or build-up around a new road) can be characterized by the user using an interactive interface and the results then used to automatically find and analyze these features. Using the ability from the Terrain Atlas to compare terrain scans at different times, changes in these features over time can also be identified. This system can help in depicting and determining what coastal features and infrastructure are in the path of a stor and might be affected during severe storms.
Learn more about this project